Decision Logs
Every rule execution is logged with the full request, response, and which conditions matched. Use logs to debug issues, audit decisions, and understand how your rules behave in production.
Logs are retained for up to 90 days on most plans and appear in the dashboard within seconds of execution.
Viewing Logs
Navigate to the Logs tab in the dashboard.
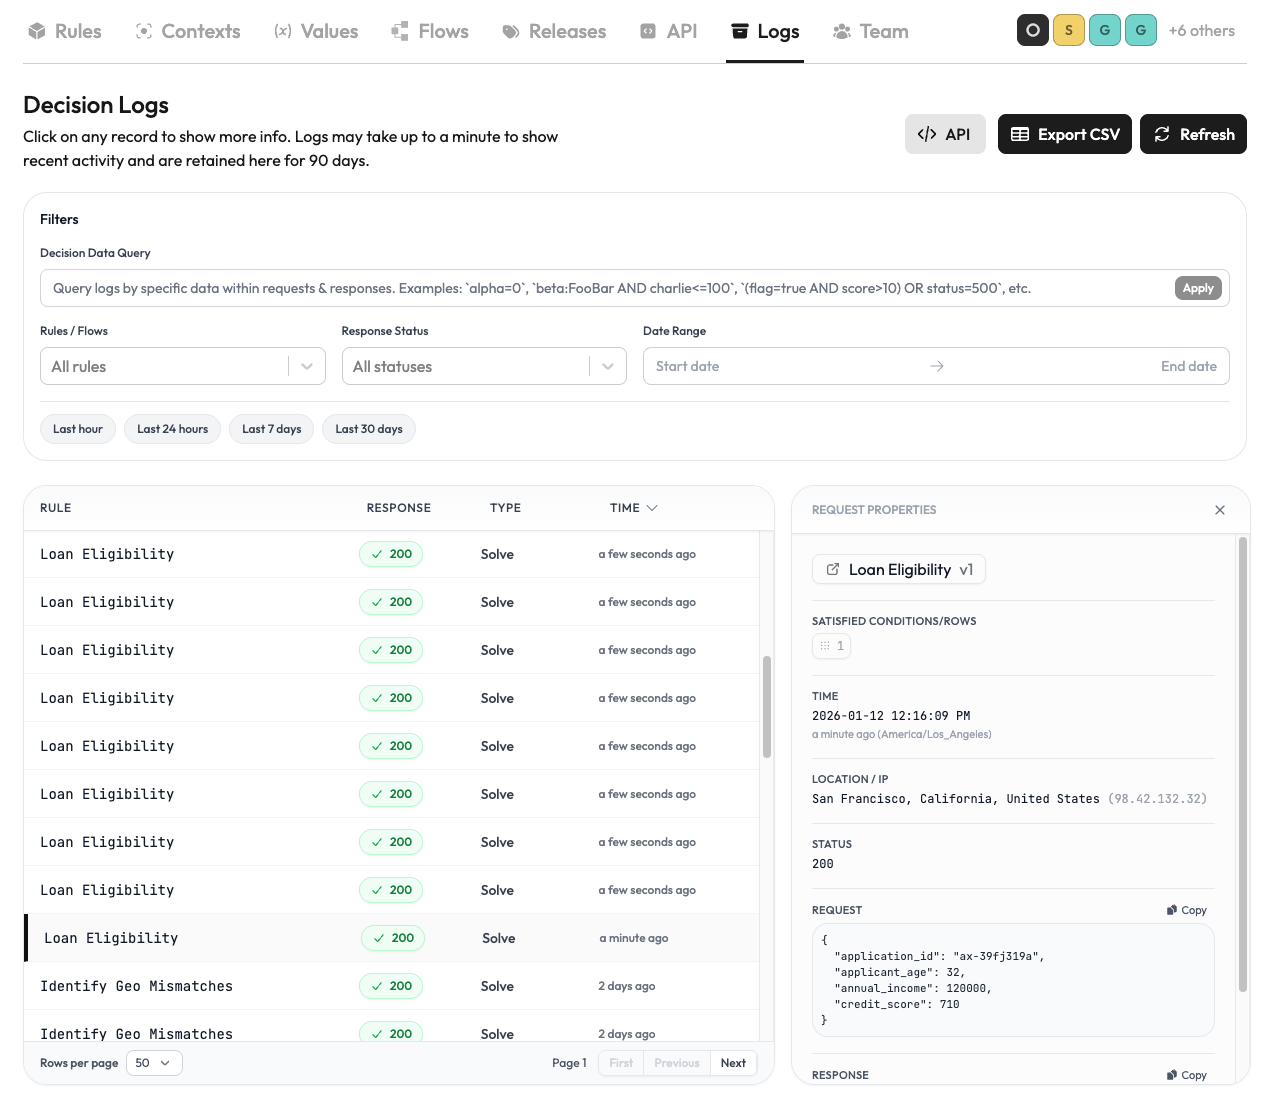
Each entry shows:
- Request and response payloads
- Which conditions matched or failed
- HTTP status, IP address, timestamp, and duration
Filter by rule, status code, or date range to narrow down what you're looking for.
Searching with DDQL
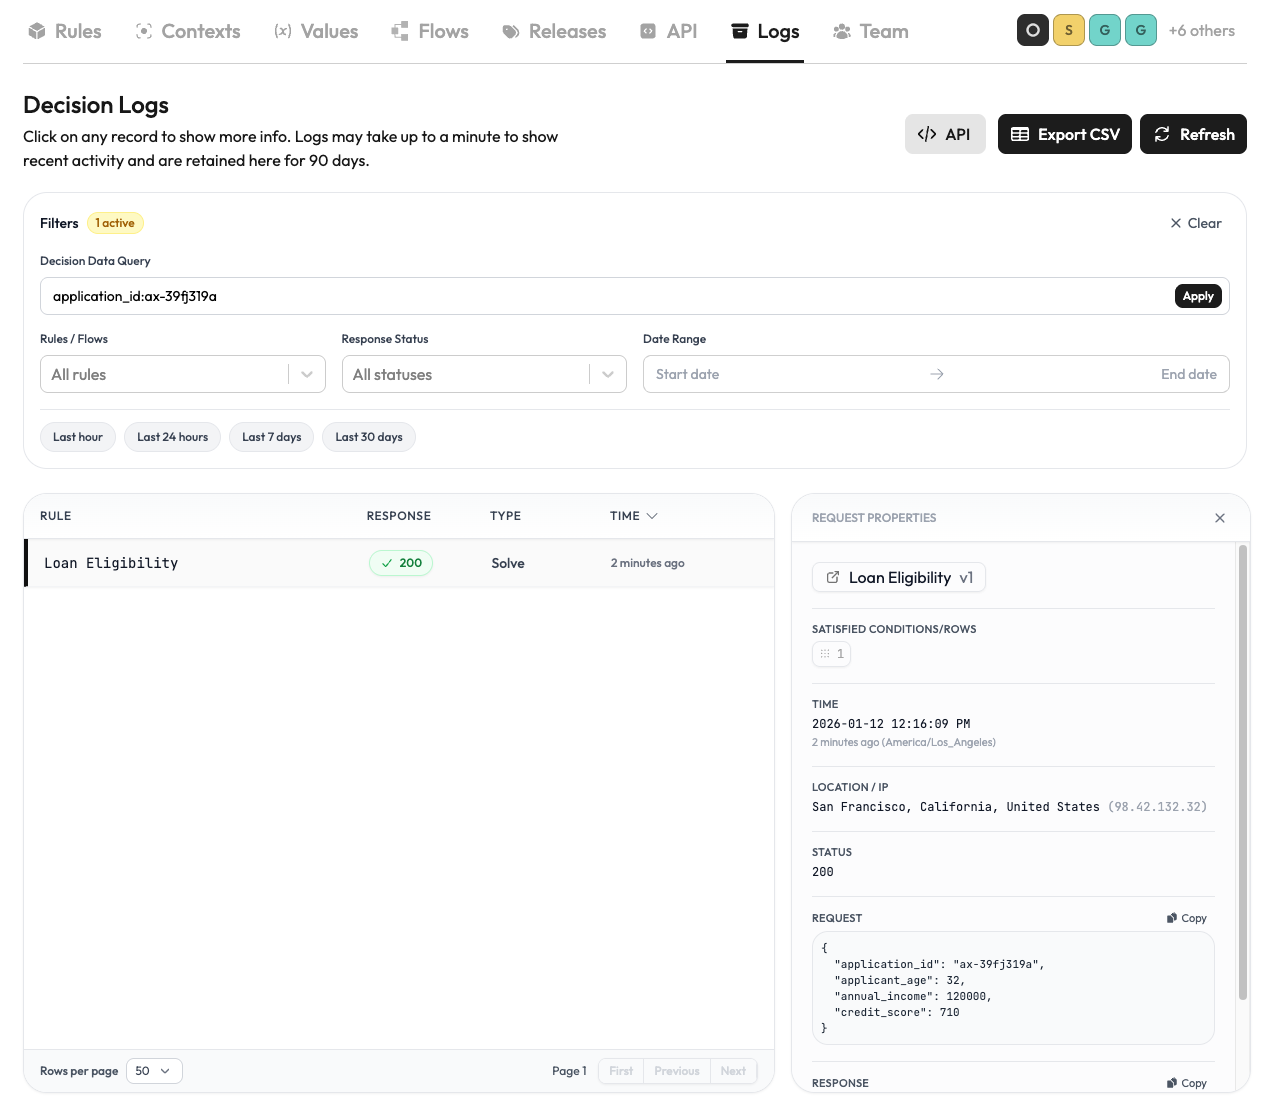
Decision Data Query Language lets you search by the actual data in your requests and responses.
For example, if I wanted to pull rule executions for a particular application_id, I might do the following:
Examples
credit_score >= 700 AND approval_decision = "denied"
customer_id = "CUST-12345"
amount > 10000 AND risk_score < 0.2
tier:gold OR tier:platinum
Operators
| Operator | Description | Example |
|---|---|---|
= | Exact match | status=approved |
!= | Not equals | status!=rejected |
: | Contains (strings) or equals | name:Smith |
< <= > >= | Comparisons | score>=700 |
Combine with AND and OR. Use parentheses for precedence:
(tier = "gold" AND amount > 100) OR tier = "platinum"Quotes optional unless value contains spaces:
status = approved
city = "New York"
Field names are case-sensitive and must match your schema. Queries search both request and response payloads automatically.
Log Details
Click any entry to see the full request/response JSON, detailed condition evaluation, and timing data.