Impact Analysis
You're about to change your credit score threshold from 700 to 650. How many more applications will get approved? Will your denial reasons shift?
Impact Analysis gives you crystal clear answers to these questions before you deploy anything.
The tool replays a configurable sample of real production requests through your modified rule logic and shows you exactly what would change—approval rates, output distributions, everything.
Analysis Methods
Two analysis methods are made available, depending on how your organization is using rules in production, and the extent of changes you're trying to simulate.
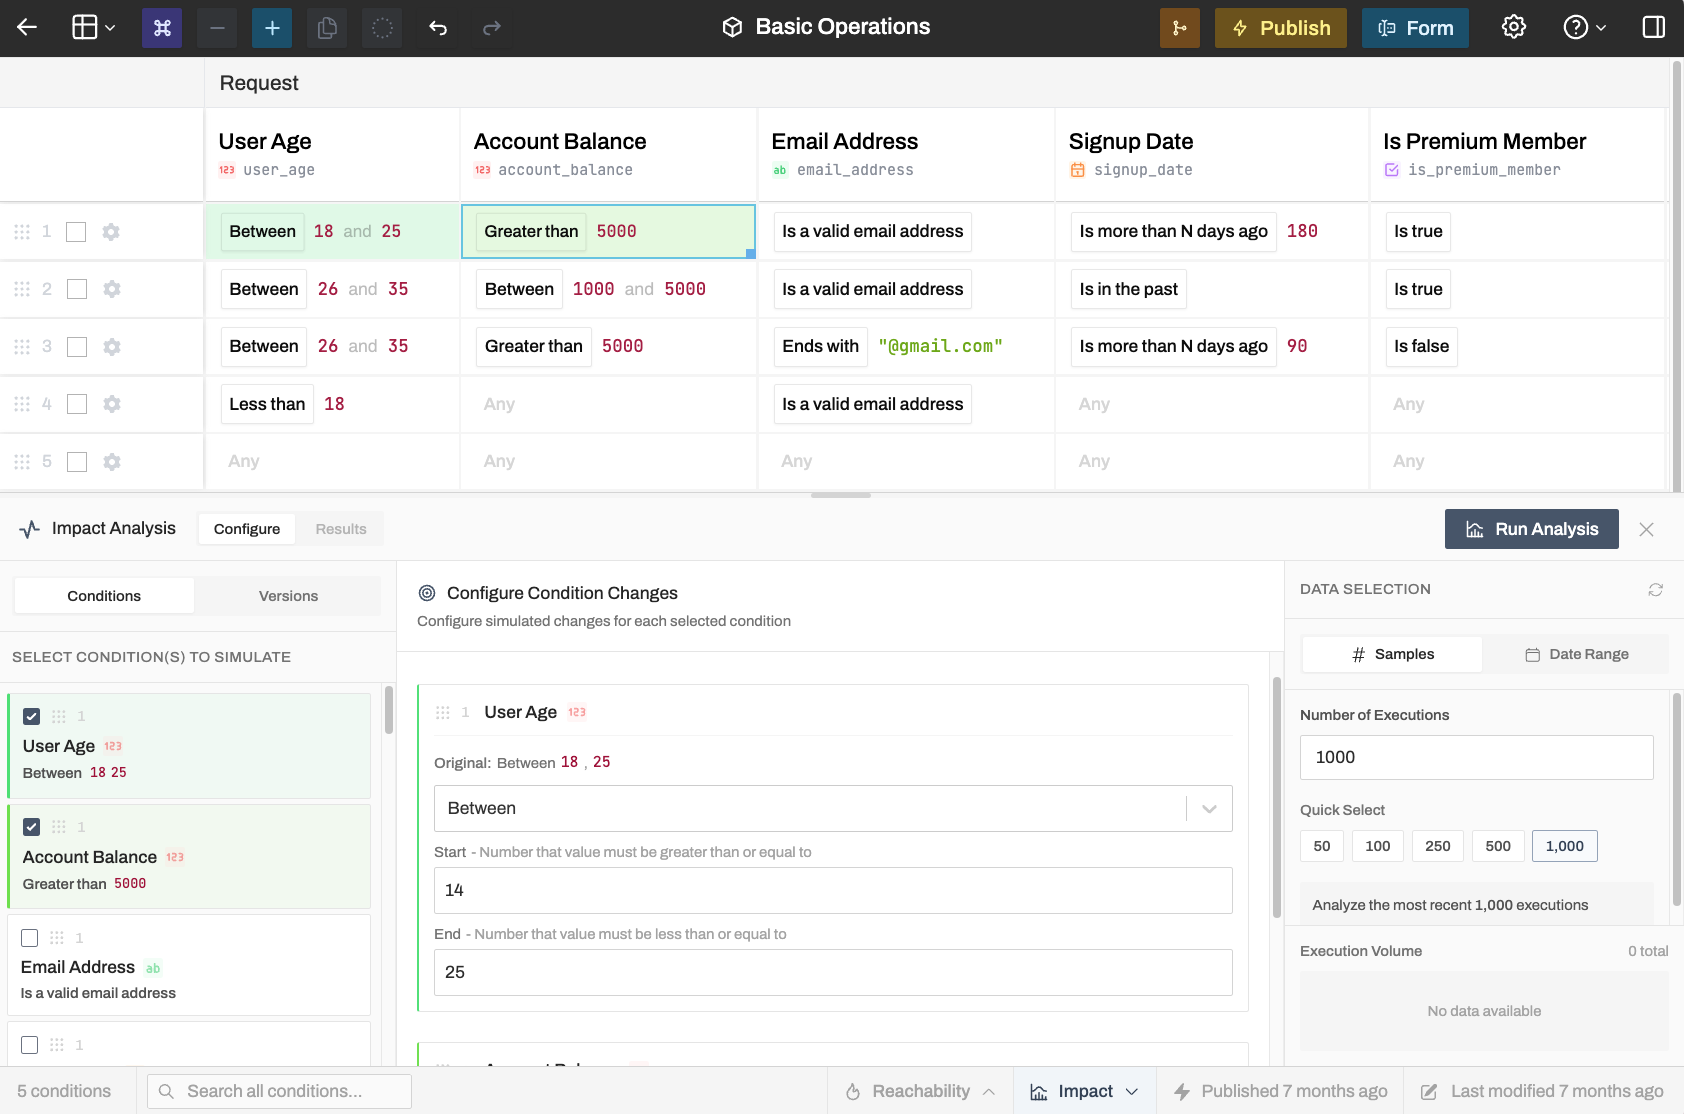
Test one or more specific condition changes (against the working rule) before publishing them:
- Click on any condition cell in your rule table
- Enter the new value you want to test
- Click Run Analysis
The results show how your outputs would shift. If you're lowering a threshold, you'll see exactly how many more requests would match. If you're tightening a condition, you'll see what would get filtered out.
You can also click on multiple condition cells to understand interactions from multiple changes to different conditions at once.
Reading the Results
Results show distribution charts for each output field. The visualization adapts to the data type:
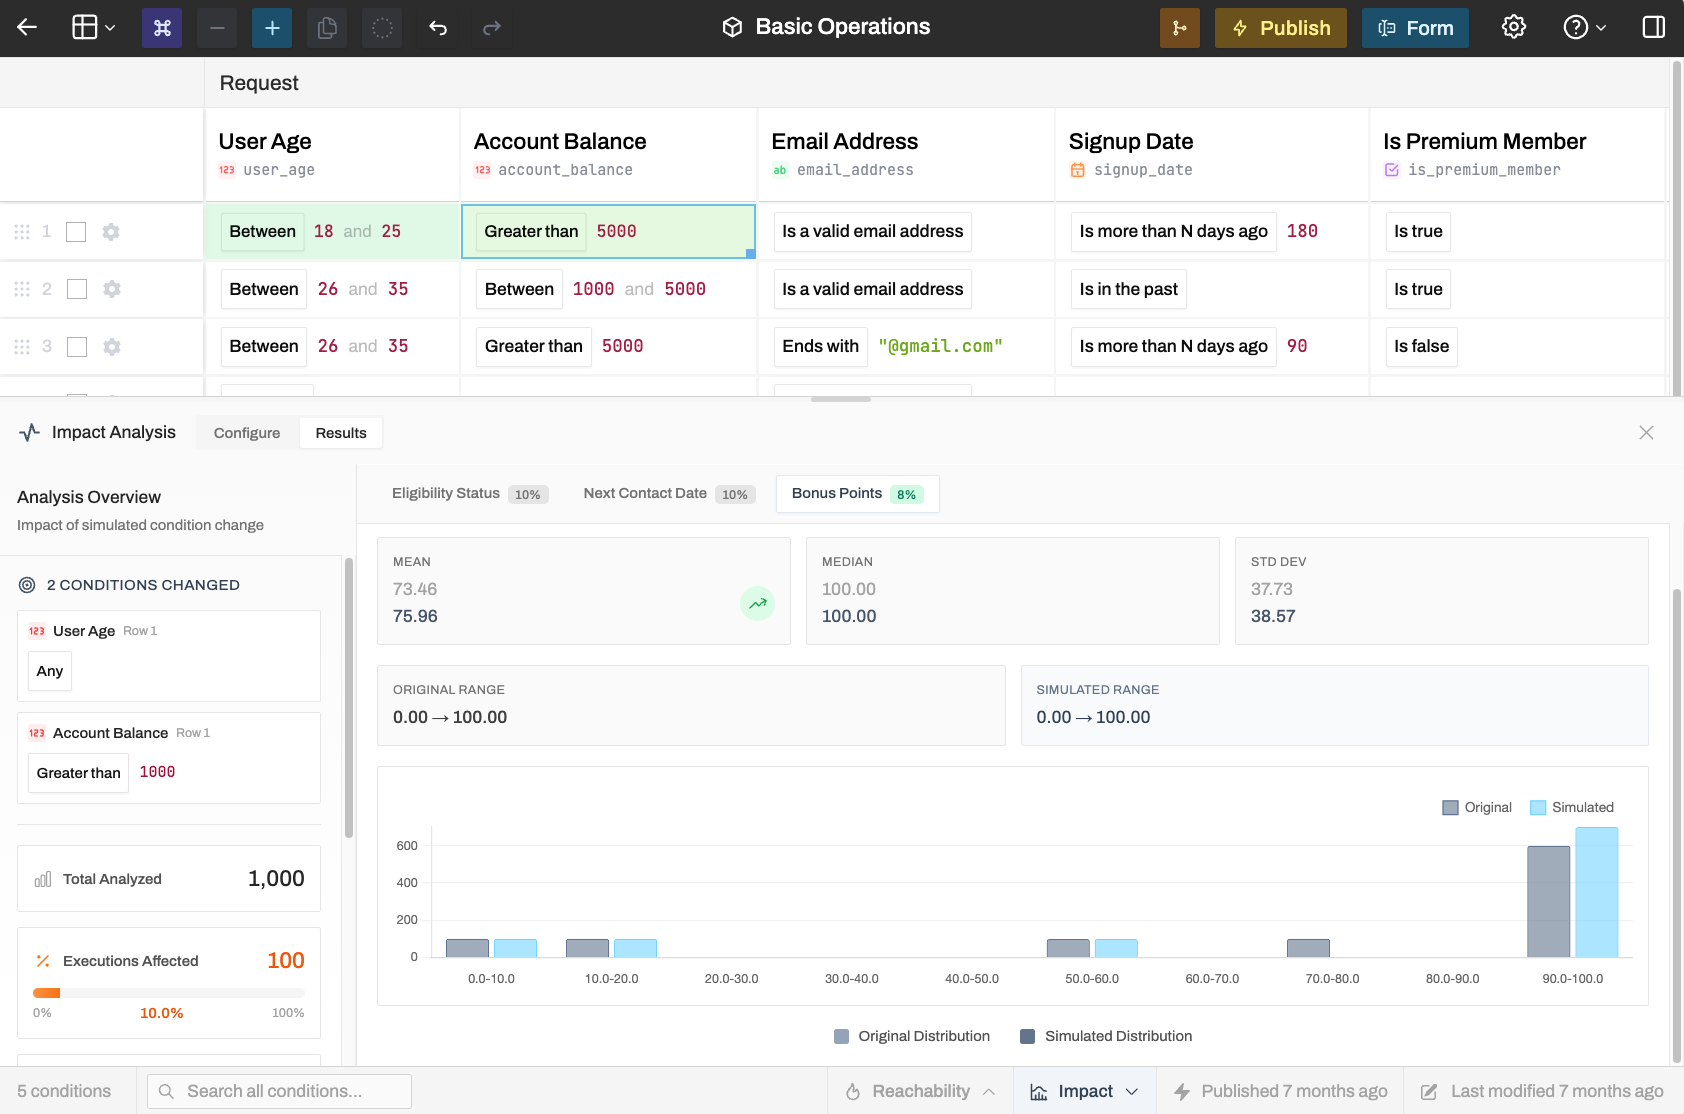
Histogram distributions with before/after comparison. Shows how value distributions shift.
Watch for null shifts—when values suddenly become null, it often means requests stopped matching any row. Impact Analysis will surface this in an alert if it detects it.
While computation is done on our servers and included with your Rulebricks plan, we recommend being very deliberate about the sample size you use– particularly between the 100k - 1M range; these can be large reports.
Example: Threshold Optimization
Say you want to approve more loan applications by lowering the credit score requirement from 700 to 650.
- Click the credit score condition cell
- Change it to 650
- Run analysis against the last 500 requests
The results might show:
- Approval rate jumps from 62% to 78%
- Average approved amount drops slightly (riskier applicants qualify for less)
- Denial reason distribution shifts from "low credit" to "high debt ratio"
Now you know exactly what you're signing up for before you ship the change.